2005onion and shallot
Autor:
Credit:
Na Commons przeniesiono z en.wikipedia.
Krótki link:
źródło:
Wymiary:
1425 x 625 Pixel (62405 Bytes)
Opis:
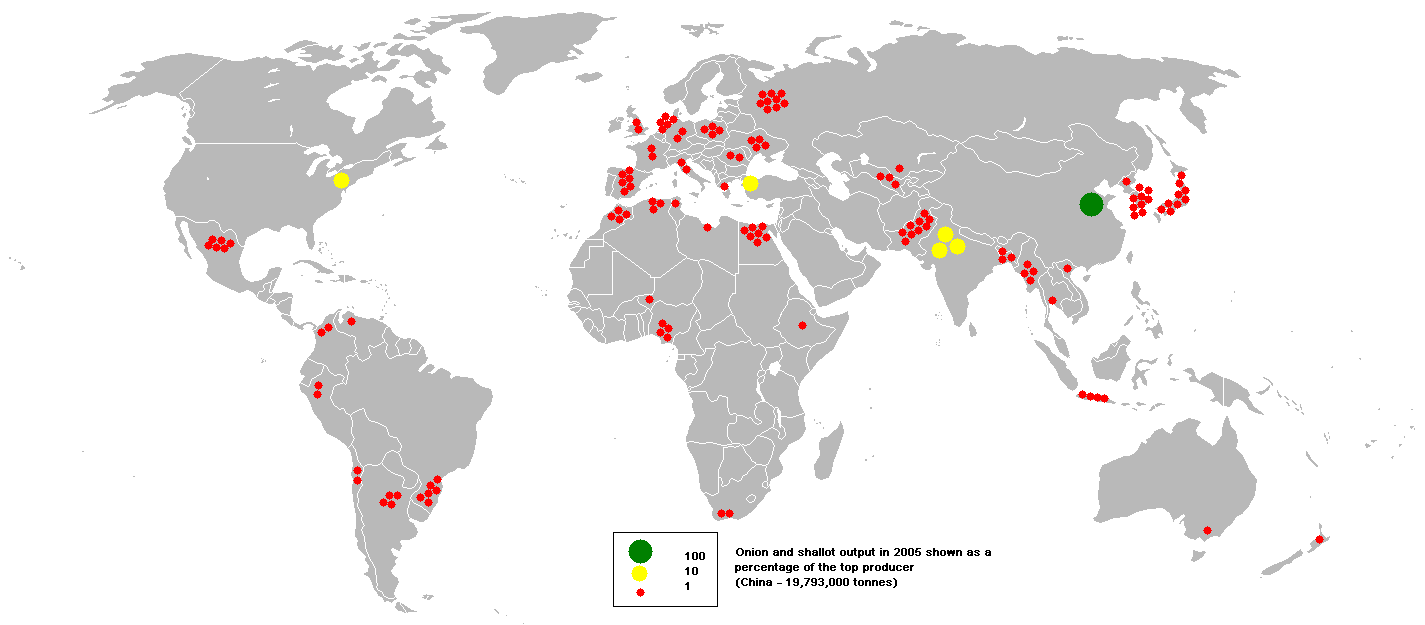
This bubble map shows the global distribution of onion and shallot output in 2005 as a percentage of the top producer (China - 19,793,000 tonnes).
This map is consistent with incomplete set of data too as long as the top producer is known. It resolves the accessibility issues faced by colour-coded maps that may not be properly rendered in old computer screens.
Data was extracted on 11th June 2007 from http://faostat.fao.org/site/336/DesktopDefault.aspx?PageID=336
Based on en:Image:BlankMap-World.png
Licencja:
Public domain
Więcej informacji o licencji można znaleźć tutaj. Ostatnia aktualizacja: Wed, 14 Dec 2022 21:18:14 GMT