Masa lodowcowa
przetłumaczył dla pl wiki Dobrzejest, wikipedia.pl : Adi4000[3] Autor oryginalny: This figure was prepared by Robert A. Rohde from published data and is part of the Global Warming Art project.
 |
Udziela się zgody na kopiowanie, rozpowszechnianie oraz modyfikowanie tego dokumentu zgodnie z warunkami GNU Licencji Wolnej Dokumentacji, w wersji 1.2 lub nowszej opublikowanej przez Free Software Foundation; bez niezmiennych sekcji, bez treści umieszczonych na frontowej lub tylnej stronie okładki. Kopia licencji załączona jest w sekcji zatytułowanej GNU Licencja Wolnej Dokumentacji. |
| Ten plik udostępniony jest na licencji Creative Commons Uznanie autorstwa – Na tych samych warunkach 3.0. | ||
| ||
| Ten szablon został dodany jako element zmiany licencjonowania. |
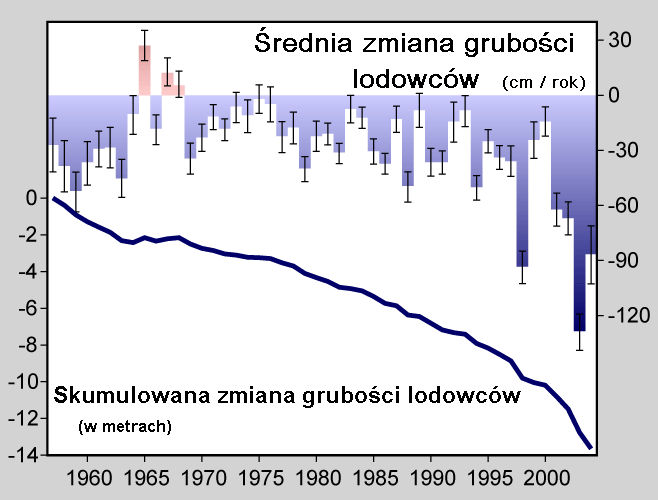
- This figure shows the average rate of thickness change in mountain glaciers around the world. This information, known as the glaciological mass balance, is found by measuring the annual snow accumulation and subtracting surface ablation driven by melting, sublimation, or wind erosion. These measurements do not account for thinning associated with iceberg calving, flow related thinning, or subglacial erosion. All values are corrected for variations in snow and firn density and expressed in meters of water equivalent (Dyurgerov 2002).
Measurements are shown as both the annual average thickness change and the accumulated change during the fifty years of measurements presented. Years with a net increase in glacier thickness are plotted upwards and in red; years with a net decrease in glacier thickness (i.e. positive thinning) are plotted downward and in blue. Only three years in the last 50 have experienced thickening in the average.
Systematic measurements of glacier thinning began in the 1940s, but fewer than 15 sites had been measured each year until the late 1950s. Since then more than 100 sites have contributed to the average in some years (Dyurgerov 2002, Dyurgerov and Meier 2005). Error bars indicate the standard error in the mean.
Other observations, based on glacier length records, suggest that glacier retreat has occurred nearly continuously since the early 1800s and the end of the little ice age, but variations in rate have occurred, including a significant acceleration during the twentieth century that is believed to have been a response to global warming (Oerlemans 2005).Więcej informacji o licencji można znaleźć tutaj. Ostatnia aktualizacja: Mon, 05 Dec 2022 23:07:06 GMT