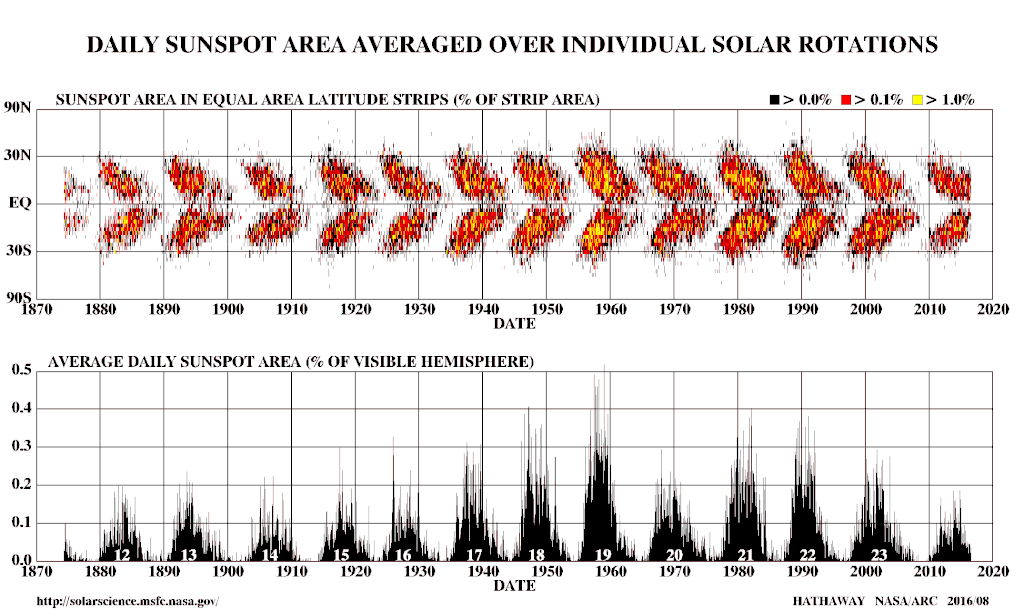
Sunspot butterfly graph
Autor:
NASA, Marshal Space Flight Center, Solar Physics
Credit:
- http://solarscience.msfc.nasa.gov/images/bfly.gif (updated monthly)
- http://solarscience.msfc.nasa.gov/SunspotCycle.shtml (explanatory text)
Krótki link:
źródło:
Wymiary:
2150 x 1280 Pixel (145508 Bytes)
Opis:
Butterfly diagram showing paired pattern of sunspots. Graph shows sunspot numbers.
- en:Spörer's law noted that at the start of an 11-year sunspot cycle, the spots appeared first at higher latitudes and later in progressively lower latitudes.
- The en:Babcock Model explains the behavior described by Spörer's law, as well as other effects, as being due to magnetic fields which are twisted by the Sun's rotation.
Licencja:
Public domain
Więcej informacji o licencji można znaleźć tutaj. Ostatnia aktualizacja: Mon, 02 Jan 2023 10:40:55 GMT
